Dashboard

Markets Dashboard

Cross-asset market structure spanning equities, bonds, FX, commodities, and volatility.

The Markets Dashboard focuses on how major asset classes are behaving, where risk appetite is improving or deteriorating, and which cross-asset relationships are driving positioning.

Equities Bonds FX Commodities Volatility Cross-Asset Performance
Monitoring Logic
Plot universe 2 charts
Refresh cycle Daily cadence
Primary use Scenario monitoring
Coverage

Core monitoring areas

Equities

Track the condition, momentum, and regime relevance of equities within the broader AlphaSync framework.

Bonds

Track the condition, momentum, and regime relevance of bonds within the broader AlphaSync framework.

FX

Track the condition, momentum, and regime relevance of fx within the broader AlphaSync framework.

Commodities

Track the condition, momentum, and regime relevance of commodities within the broader AlphaSync framework.

Volatility

Track the condition, momentum, and regime relevance of volatility within the broader AlphaSync framework.

Cross-Asset Performance

Track the condition, momentum, and regime relevance of cross-asset performance within the broader AlphaSync framework.

Representative Charts

Linked plot views

Browse full library
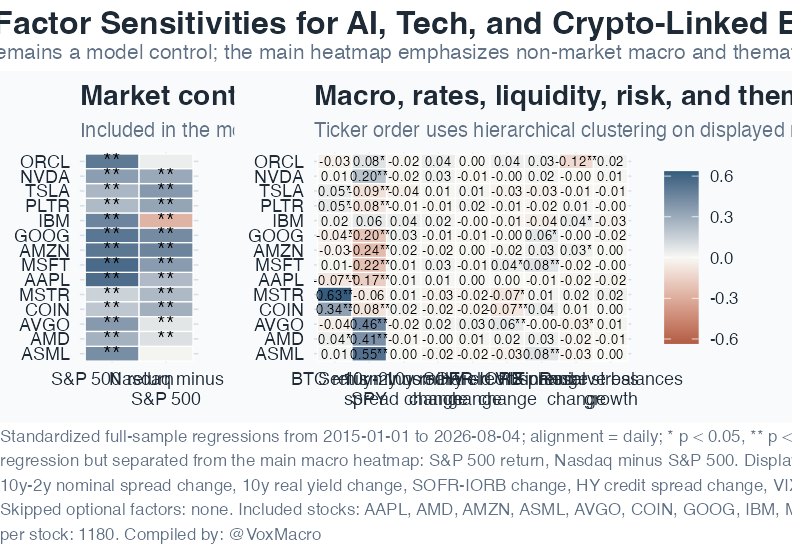
Macro Factor Exposure Heatmap

Macro Factor Exposure Heatmap

Market controls separated from non-market macro and thematic exposures

Equities Macro Sensitivity United States Daily 2026-04-30

A cross-sectional heatmap of standardized factor sensitivities for a tech, AI, and crypto-linked equity universe, with the economic story focused on non-market factors.

Open chart
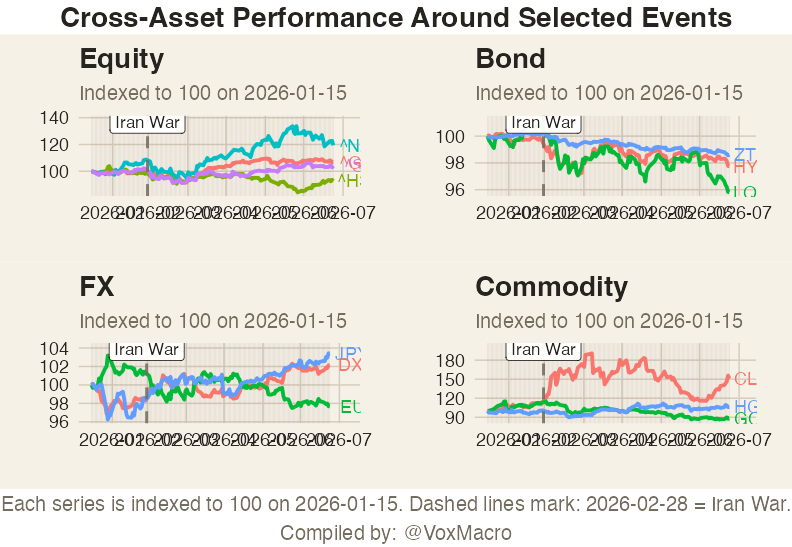
Cross-Asset Performance Around Selected Events

Cross-Asset Performance Around Selected Events

Equity, bond, FX, and commodity responses indexed from a common start date

Equities Cross-Asset Event Study Global Event 2026-04-30

A Yahoo-based cross-asset event board showing how major market groups behave around selected geopolitical or macro events when rebased to a common level.

Open chart