Macro
Short-Term Liquidity Tightness Dashboard
Funding pressure, reserve drain, transmission, and an integrated tightness score
Freshness: Current
Data through 2026-09-23
Research Context Method and Sources Show methodology, sources, and freshness metadata
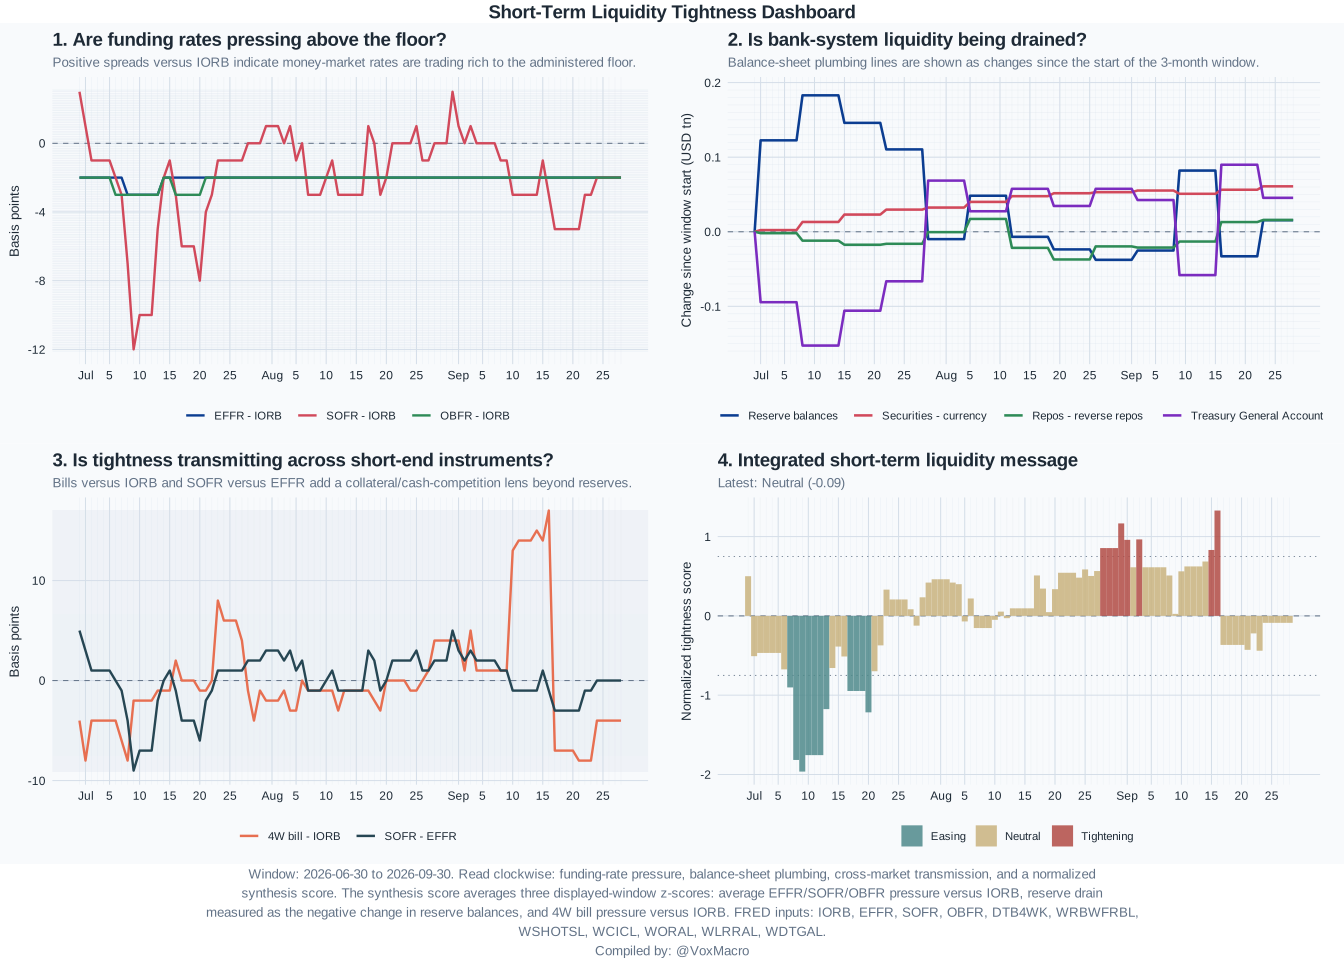
A short-horizon FRED board tracking whether US money-market rates are pressing above the administered floor and whether reserve-side plumbing is tightening.
This board focuses on the latest three months of US liquidity plumbing. Reading clockwise, it tracks floor pressure in EFFR, SOFR, and OBFR versus IORB; balance-sheet drain through reserves, TGA, and related plumbing components; cross-market transmission through bill and secured funding spreads; and a normalized integrated tightness score.
FRED
United States
Daily
2026-09-23
Freshness: Current
2026-09-30T01:03:07Z
2026-08-13
fred-liquidity-tightness-dashboard
plot
Source Detail
IORB
EFFR
SOFR
OBFR
DTB4WK
WRBWFRBL
WSHOTSL
WCICL
WORAL
WLRRAL
WDTGAL
Tags
liquidity
fed
reserves
sofr
effr
iorb
tga
Disclosure
Educational research only. Not investment advice.
Daily Report
Get this chart in the daily report.
Receive chart highlights, macro context, and related strategy observations by email.
Educational content only. Not financial advice.