Macro
10-Year Treasury Shock Persistence
Recent nominal-rate shocks versus simulated and realized follow-through
Freshness: Lagged
Data through 2026-09-24
Research Context Method and Sources Show methodology, sources, and freshness metadata
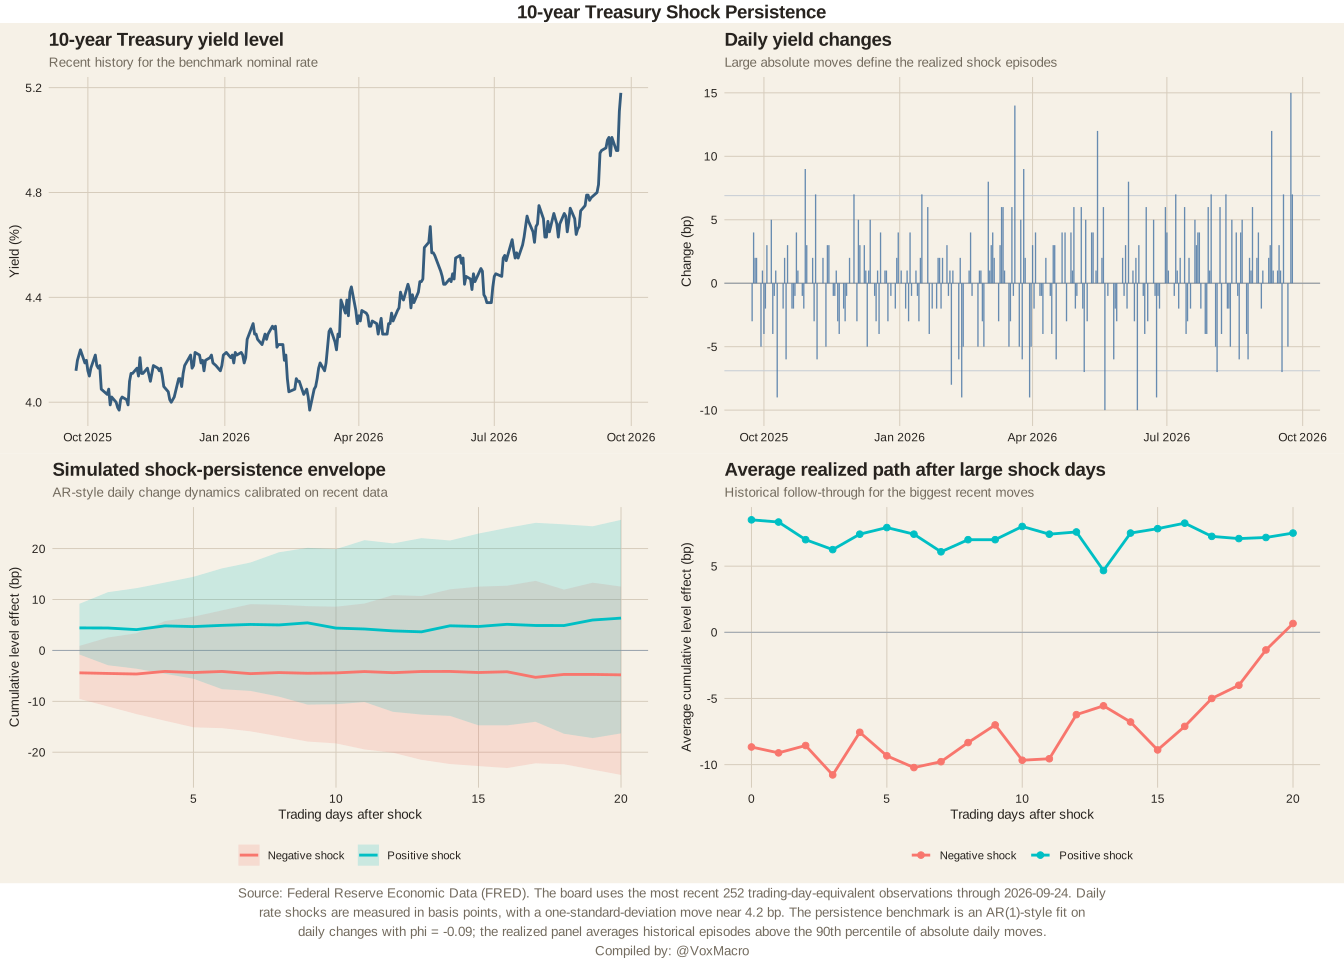
A FRED-based rates board showing the recent 10-year Treasury yield, large daily shocks, an AR-style persistence envelope, and average realized paths after major moves.
This board studies whether recent 10-year Treasury shocks tend to mean-revert or persist. It combines recent level history, daily changes, a simple AR-style persistence benchmark, and the average historical follow-through after large absolute shock days.
FRED
United States
Daily
2026-09-24
Freshness: Lagged
2026-09-30T01:03:11Z
2026-08-13
fred-rate-shock-persistence-board
plot
Source Detail
DGS10
Tags
rates
treasury
duration
fed
persistence
Disclosure
Educational research only. Not investment advice.
Daily Report
Get this chart in the daily report.
Receive chart highlights, macro context, and related strategy observations by email.
Educational content only. Not financial advice.