Markets
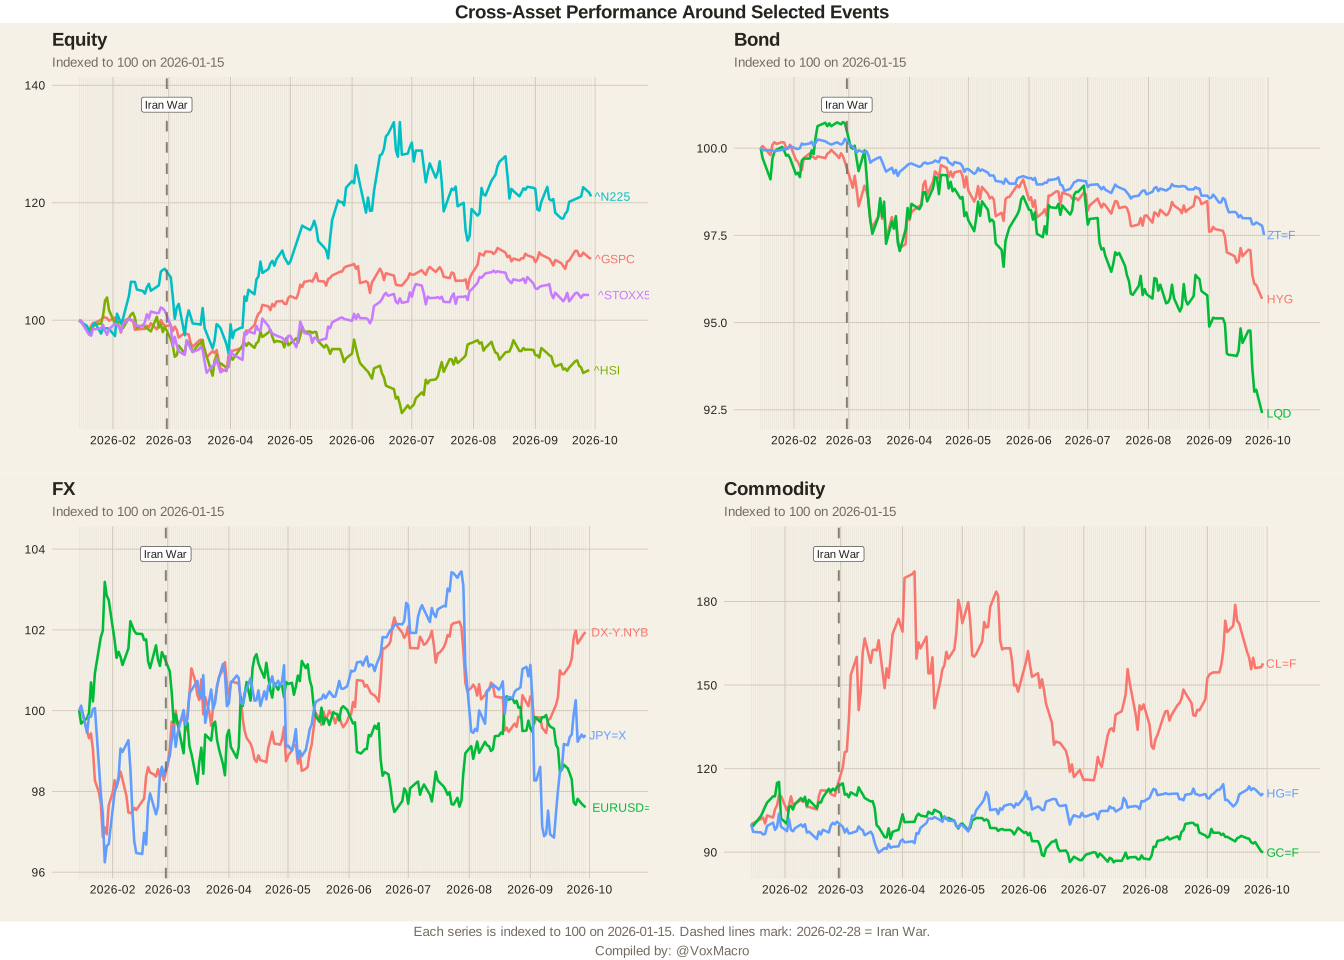
Cross-Asset Performance Around Selected Events
Equity, bond, FX, and commodity responses indexed from a common start date
Freshness: Current
Data through 2026-09-28
Research Context Method and Sources Show methodology, sources, and freshness metadata
A Yahoo-based cross-asset event board showing how major market groups behave around selected geopolitical or macro events when rebased to a common level.
This board compares indexed performance across equities, bonds, FX, and commodities around one or more selected event dates. It is designed for briefing use, so the emphasis is on relative path comparison rather than raw price levels.
Yahoo Finance
Global
Event
2026-09-28
Freshness: Current
2026-09-30T01:03:12Z
2026-08-13
yahoo-cross-asset-event-board
plot
Source Detail
^GSPC
^STOXX50E
^N225
^HSI
ZT=F
HYG
LQD
DX-Y.NYB
EURUSD=X
JPY=X
GC=F
HG=F
CL=F
Tags
cross-asset
event study
equities
bonds
fx
commodities
Disclosure
Educational research only. Not investment advice.
Daily Report
Get this chart in the daily report.
Receive chart highlights, macro context, and related strategy observations by email.
Educational content only. Not financial advice.